
The OpenAI API is a powerful tool that enables developers to integrate state-of-the-art natural language processing capabilities into their applications. As the usage of the OpenAI API grows, it becomes essential to monitor and track the API calls for various reasons. In this blog post, we will explore why monitoring OpenAI API calls is important and how you can leverage Splunk, a leading data analysis and monitoring platform, to accomplish this task effectively.
Why Monitor OpenAI API Calls?
Monitoring API calls allows you to gain insights into how your application interacts with the OpenAI API. By analyzing usage patterns and trends, you can optimize your API requests, fine-tune parameters, and improve overall performance and efficiency.
Splunk for OpenAI API Monitoring
With Splunk, you can collect, index, and visualize data from various sources, including API logs, performance metrics, and cost calculations. By using Splunk’s powerful features, such as dashboards, alerts, and reports, you can gain actionable insights, make data-driven decisions, and ensure optimal usage of the OpenAI API.
In the following sections, I will walk you through the process of setting up OpenAI API monitoring with Splunk, including configuration steps, cost calculations, dashboard creation, and the use of monkey patching techniques.
Let’s dive in!
Getting Started
Note: Remember to refer to the original readme file from the openai-splunk-monitoring GitHub Repo for complete instructions and code details.
Disclaimer: The sample code and instructions provided in this blog post are for illustrative purposes only. Always review and adapt them to meet your specific requirements and security practices.
Step 1: Configure Splunk HEC
- Create a new index
open_ai. - Configure a new HEC:
Settings -> Data Inputs -> HTTP Event Collector -> + Add new. - Set name, e.g.
open_ai. - Select sourcetype
_jsonand default index -open_ai. - Review configurations.
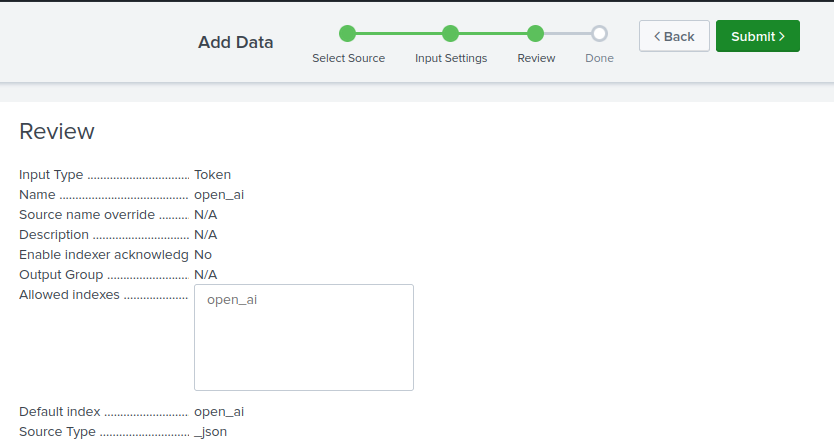
- Copy your Token Value.
- Submit.
Step 2: Create Lookup
Create a lookup table using the provided openai_prices.csv file.
- Go to
Settings -> Lookupsand click+ Add newunder theLookup table files. - Upload
openai_prices.csvfile and save. - Change permissions from
Privateto Global or App. - Now go back to Looukups and a add new
Lookup definition. - Name:
openai_prices. - Select the file that was previously uploaded
openai_prices.csv. - Check
Advanced optionsandWILDCARD(model)to theMatch typefield. - Save.
Step 3: Configure your code
- Set your environment variables
SPLUNK_HEC_URL(e.g., https://localhost:8088/services/collector)SPLUNK_HEC_TOKEN(from Step 1: Configure Splunk HEC)OPENAI_API_KEY(get it here: https://platform.openai.com/account/api-keys)
- Add
openai_splunk_monitor.pyfile from the openai-splunk-monitoring git repo. - Add the following lines to your code:
| |
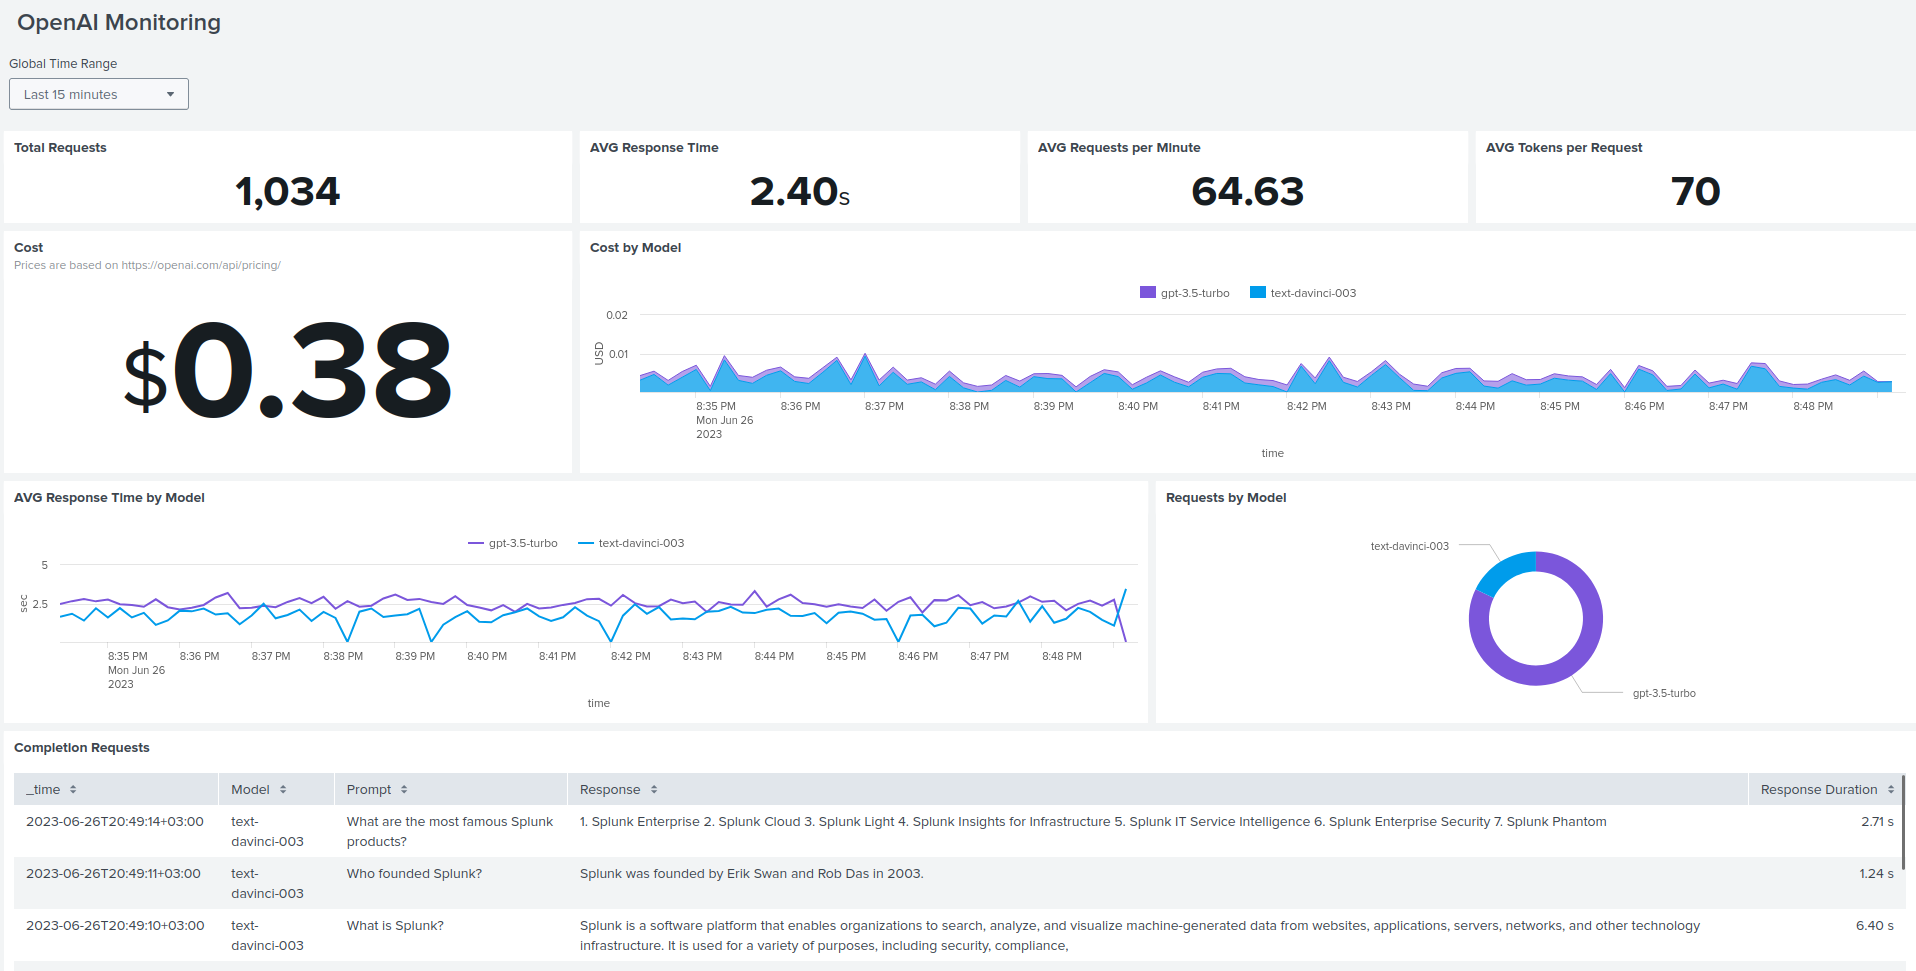
Step 4: Add dashboard
- To visualize the collected data, we create a custom dashboard in Splunk’s Dashboard Studio. Simply import the code from
dashboard.jsoninto your Splunk instance
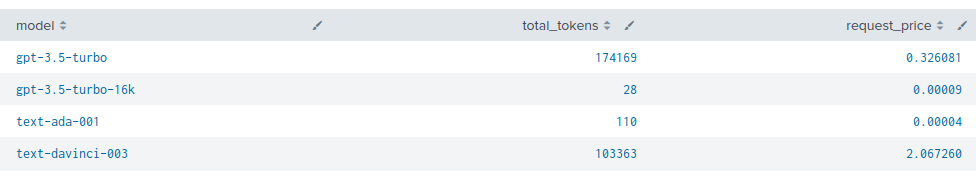
Cost Calculation
The calculation of the funds spent is performed in Splunk by using the lookup that was created in Step 2: Create Lookup.
Here is an example SPL to calculate the cost per model
| |
Monkey Patching
To capture response metrics and other relevant data, we employ monkey patching. Monkey patching is a technique that allows us to modify the behavior of the Completion call dynamically during runtime. By applying this technique, we can collect the necessary information and send it to Splunk for further analysis.